These are the results of our first Hackathon as a team! We worked together to create these two different data visualizations:
Chart #1: Variable Width Bar Chart
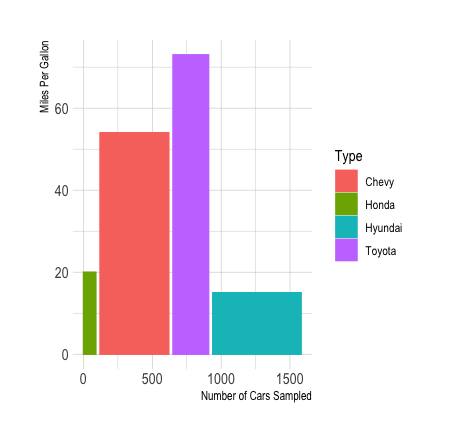
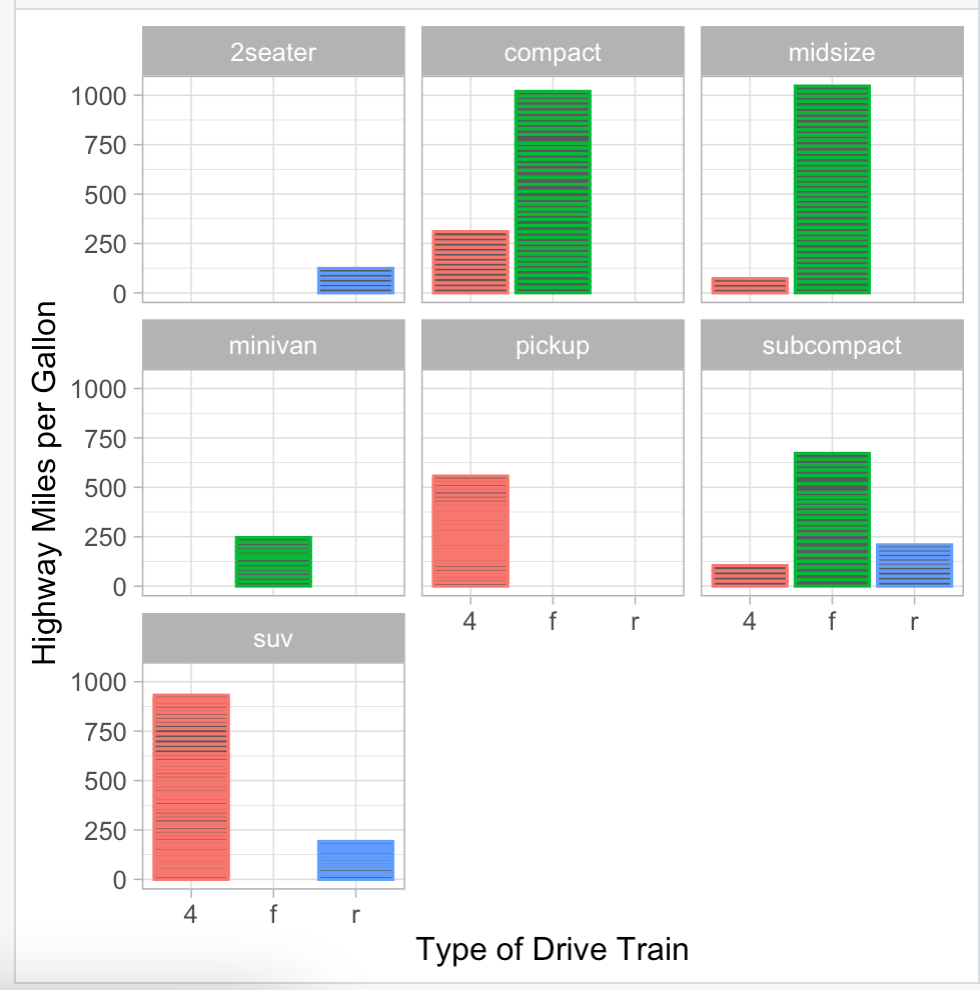
Chart #2: Stacked Bar Charts
Thanks to my team: Leslie, Ana, Theophilus, Michelle and myself. Shoutout to Michelle for staying up late and working hard, and to Leslie for making the final breakthrough that led to our finished charts!